Apache ECharts is the charting engine. WeeWX-JAS comes with many predefined charts. A few examples are below.
This chart shows multiple data series in a single chart. 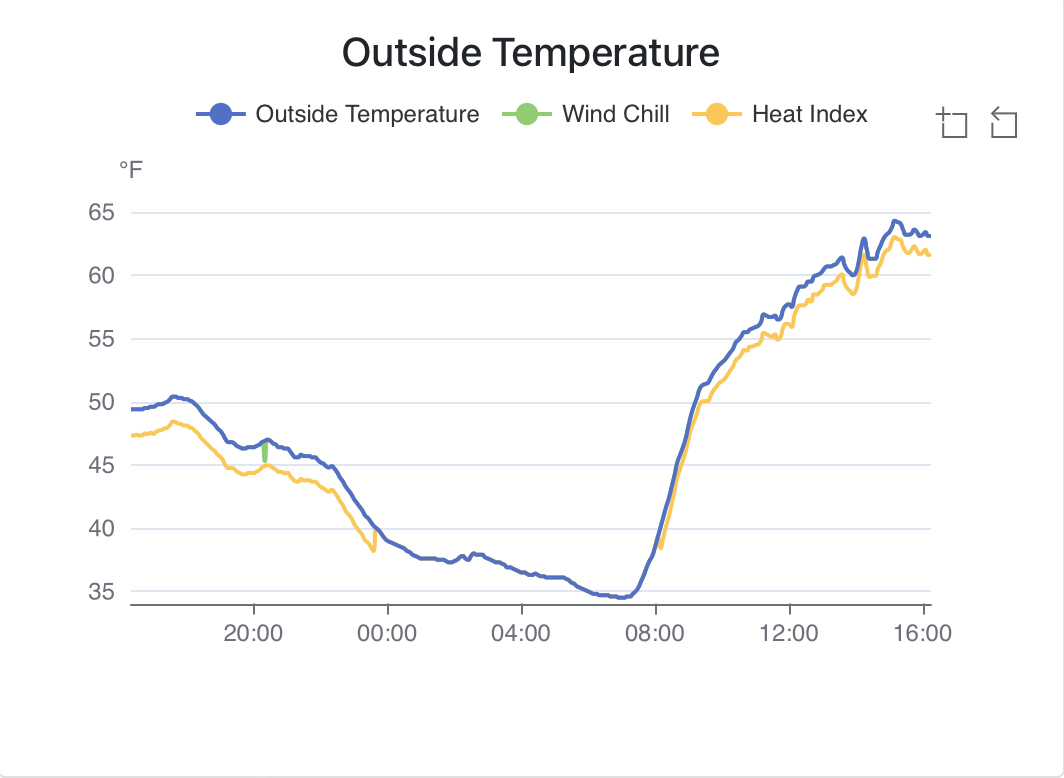
Here is a chart with multiple y-axis charting data with lines and a scatter plot. 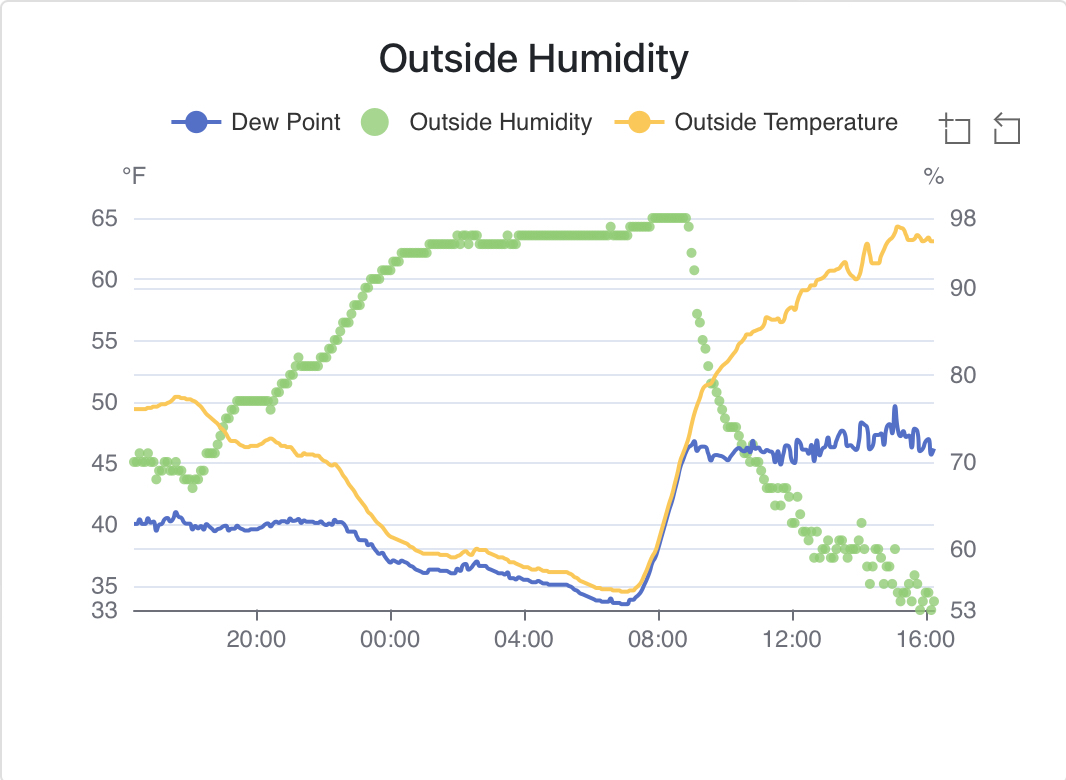
WeeWX-JAS also has the ability to chart historical data. This charts visualizes data across years. 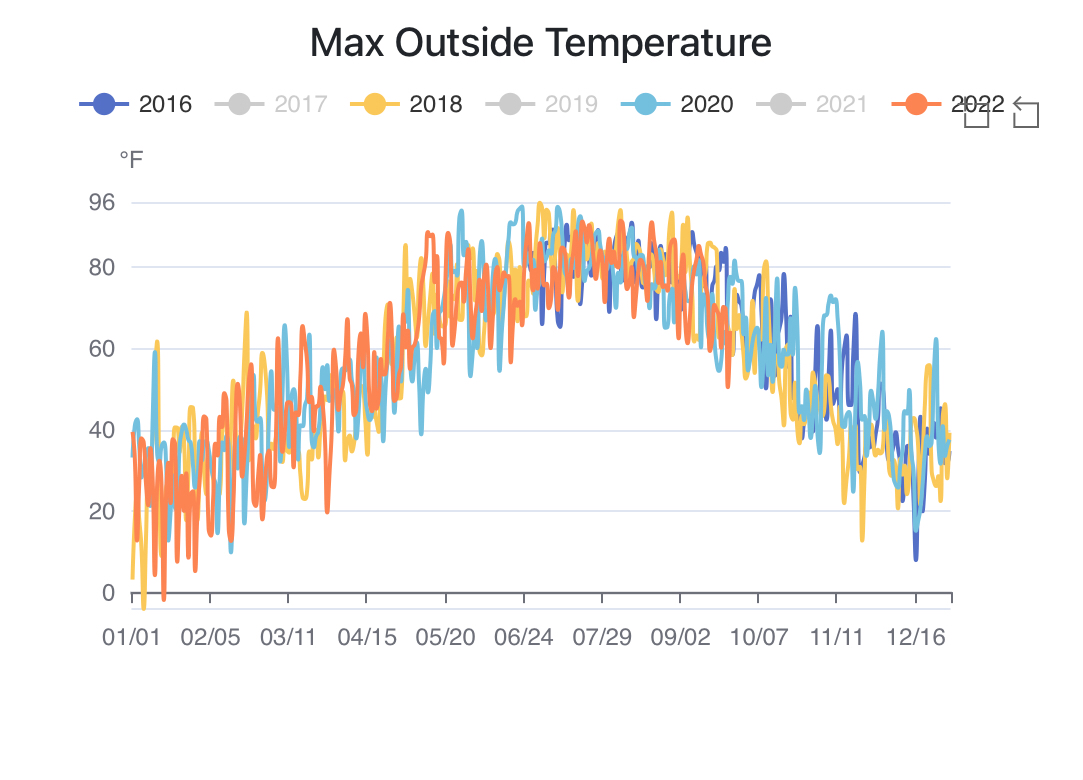
To see the predefined charts, browse the [[chart_definitions]] section of skin.conf. Each section under [[[chart_definitions]] is a separate chart.
In addition to the predefined charts, it is ‘easy’ to define additional charts
To display a chart it needs to be added to a page.
The following chart options ate configured in the `[[[[pages]]][[[[[page-name]]][[[[[[chart-name]]]]]] section.
chart_modal =
Overrides the chart_modal for this specific chart.
series_type =
When set to mqtt the chart will be updated when a new MQTT message is received. The setting mqtt is mutually exclusive with setting chart_modal = True. Experimental - maybe removed in the future.